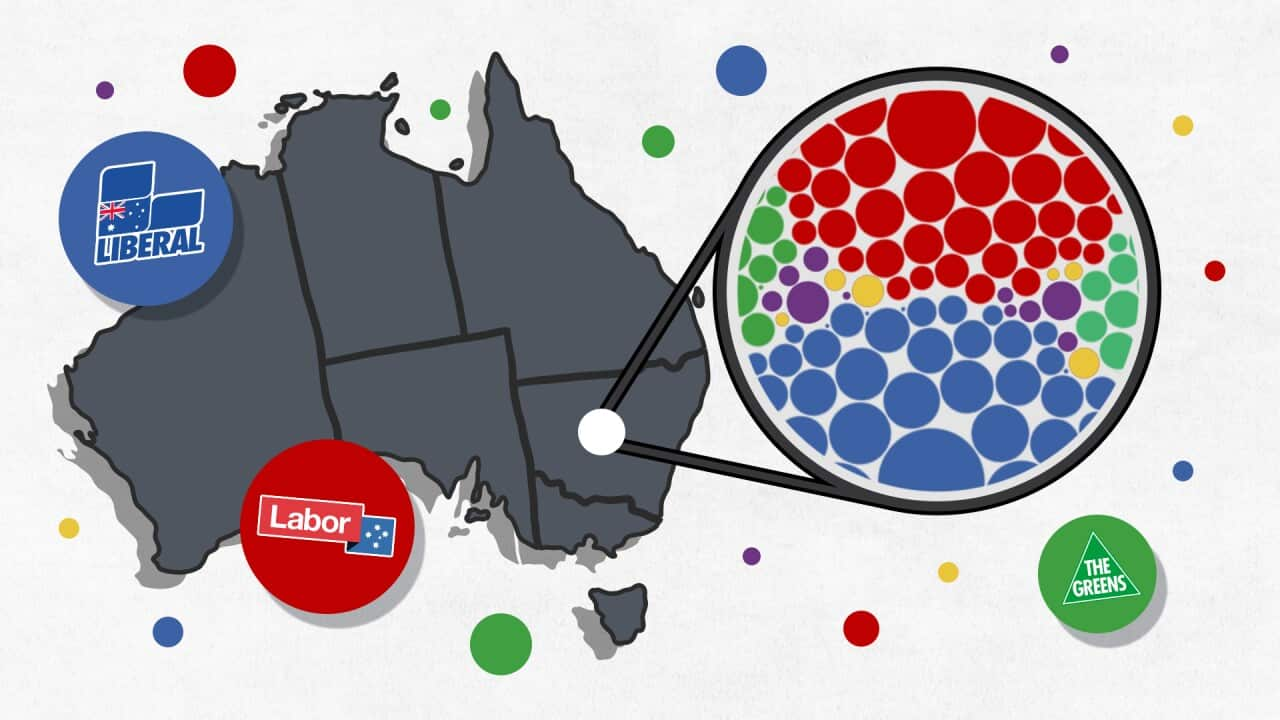
Using data from the Australian Electoral Commission based on "two candidate preferred" (TCP) preferential voting results for the House of Representatives, we’re able to visualise the evolving voting landscape in the lead-up to the 21 May election.
Use the drop down menus to see your state, from cities to rural polling stations, to get a snapshot across across Australia of how your local area voted over time.


